Why Solar Cell Efficiency Tables Matter
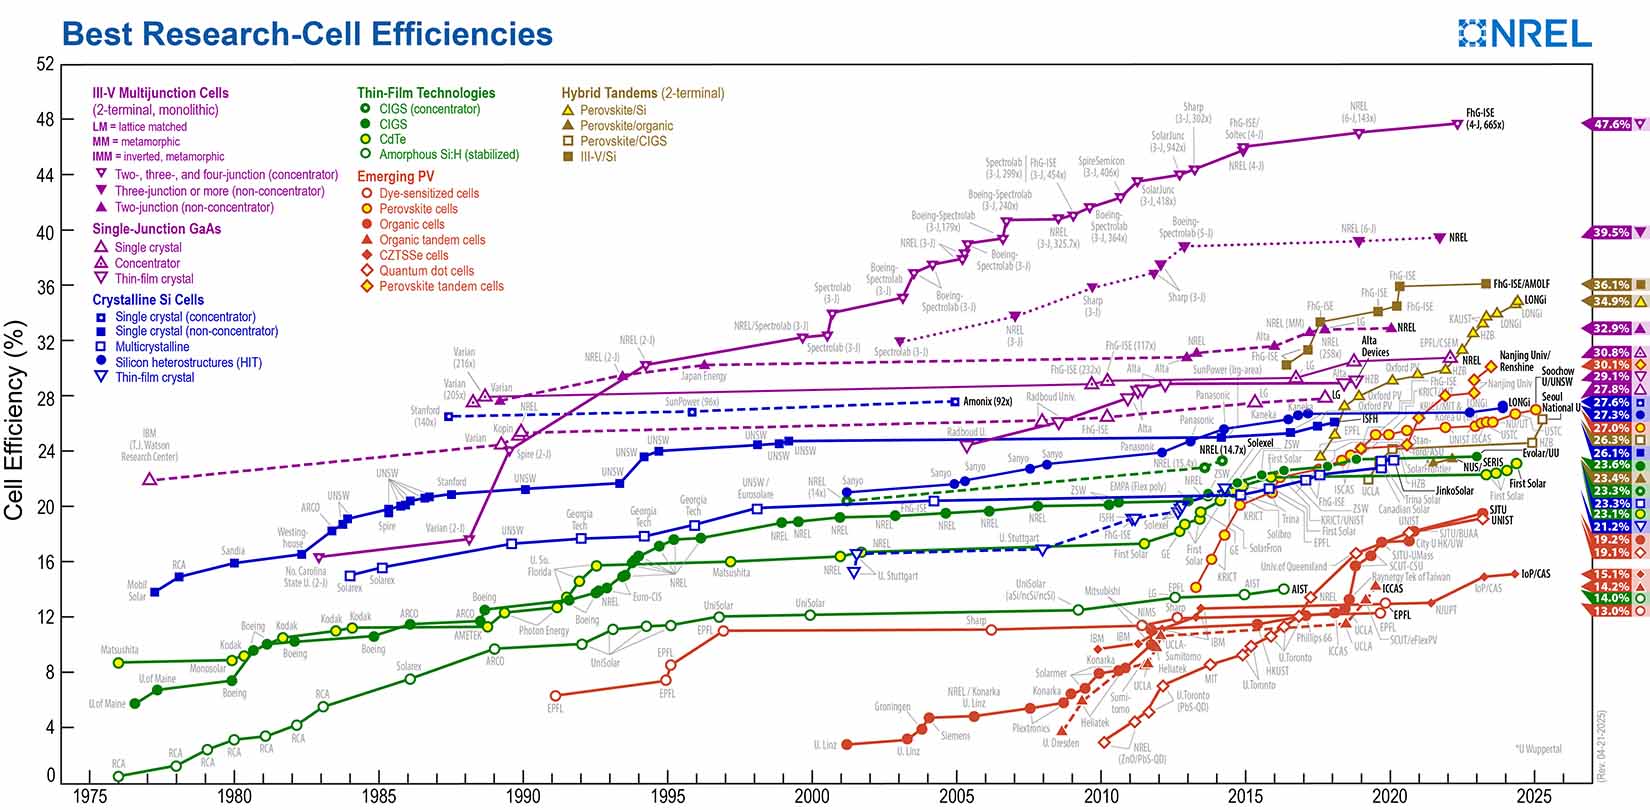
Solar cell efficiency tables are essential for comparing the performance of different photovoltaic (PV) technologies. Whether you're a homeowner, researcher, or industry professional, these tables help you identify the most efficient solar panels available.
Efficiency measures how well a solar panel converts sunlight into electricity. Higher efficiency means more power from the same surface area crucial for maximizing energy output, especially in space-constrained installations.
More details : https://www.nrel.gov/pv/cell-efficiency
Understanding Solar Cell Efficiency Tables
What Do Efficiency Tables Show?
Solar cell efficiency tables rank PV technologies based on their energy conversion rates. They include:
Laboratory vs. Real-World Efficiency – Lab-tested cells often outperform commercial panels.
Different Technologies – Monocrystalline, polycrystalline, thin-film, and perovskite cells.
Certification Standards – NREL, Fraunhofer ISE, and other leading institutions validate results.
Key Metrics in Efficiency Tables
Peak Efficiency (%) – The highest recorded efficiency under ideal conditions.
Temperature Coefficient – How efficiency drops in high heat.
Low-Light Performance – Efficiency in cloudy or indirect sunlight.
Latest Trends in Solar Cell Efficiency (2024)
1. Perovskite Solar Cells Break Records
Perovskite cells are making waves with efficiencies exceeding 33% in tandem configurations. Their low-cost production and flexibility make them a game-changer.
2. TOPCon Technology Gains Traction
Tunnel Oxide Passivated Contact (TOPCon) panels now achieve over 24% efficiency, rivaling traditional monocrystalline silicon.
3. Bifacial Panels Improve Energy Yield
Bifacial solar panels capture sunlight on both sides, boosting efficiency by 10-20% depending on installation conditions.
How to Use Solar Cell Efficiency Tables for Your Needs
For Homeowners:
Compare residential panel efficiencies (typically 18-22%).
Check warranty and degradation rates alongside efficiency.
For Businesses & Large Installations:
Prioritize high-efficiency, space-saving panels for rooftops or solar farms.
Evaluate long-term ROI based on efficiency and durability.
For Researchers & Developers:
Track emerging technologies like perovskite and organic PV.
Analyze scalability and production costs alongside lab results.
Future of Solar Efficiency: What’s Next?
With advancements in multi-junction cells, quantum dots, and AI-driven optimization, solar efficiency is set to climb even higher. The U.S. Department of Energy’s 2030 targets aim for 30%+ efficiency at affordable costs.
Final Thoughts
Staying updated with solar cell efficiency tables ensures you make informed decisions—whether buying panels or researching next-gen tech. Bookmark trusted sources like NREL’s efficiency charts and keep an eye on 2024’s breakthroughs!


.webp)
0 Comments